Filtering, Clarrification and DTM-DSM geneartion of Airbrone LiDAR data
| Project Area Standard I | |
| Area | 161000 Sq Km. |
| Point densities | 15pts/m2 |
| Project Area Standard II | |
| Area | 4300 Sq Km. |
| Point densities | 45 pts/m2 |
Product to delivery :
Product 1 : Point cloud classify of Standard I area
Product 2 : Point cloud classify of Standard II area
Product 3 : DTM format GRID (1m X 1m)
Product 4 : DSM format GRID 1m X 1m for Area Standard I
Product 5 : DSM format GRID 0.5m X 0.5m for Area in Standard II
- Project setup has been done by using clinet provded LAS tiles and boundries with their respective names.
- Flightline overlap have been cut for Standered_I blocks and no need to cut overlap in Standered_II blocks.
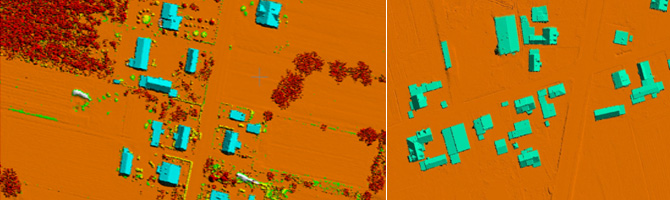
- Classification of LiDAR data has been done mainly in two steps. a) Recovery of valid data from other classes. b) Cleaning of each class by transferring the unwanted data to other classes.
- Recovery of valid ground points from other classes at road edges, embankments, along the streams and below vegetation areas.
- Checking and recovery for missing vegetation points from unclassified and vegetation classes and same time transfer of unwanted points to other respective classes.
- Checking and recovery for missing vegetation points from unclassified, building and the vegetation class. Classification of unwanted points to other respective classes, thus the Vegetation class is finalized
- Classification of bridges to building classes
- Classification of water bodies (streams, rivers, coast line)
- Finally ground class has been finalized by removing artifacts in ground class.
a) Quality checking has been done by creating editable model for each class and with combination of ground class.
b) Checking for missing and wrong classification of points.
c) Ensure the Point classes as per the given List
d) Refer the detailed Quality Check List
 No other class should exist except below mentioned class.
1. Never Classified
2. Ground
3. Low vegetation
4. Medium vegetation
5. High vegetation
6. Buildings
7. Low point
8. Water
9. Overlap Points- Make sure that data exist in proper layer and verify the LiDAR data as per checklist.
Classification procedure
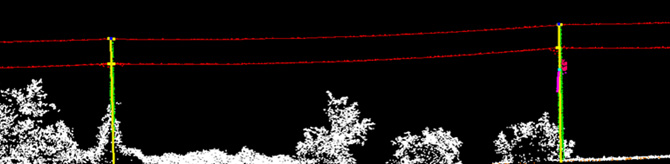
- Mobile_LiDAR point cloud has been classified into different classes like bare Earth, Vegetation, Low points, and noise by using automatic classification method. Bare earth and vegetation classes were verified by creating surface model.
- Then Distribution power lines, secondary lines, utility poles, pole- features, Guy wires, all available power line, Secondary line and Guy wire attachments were manually classified in to their respective classes.

- Power line features has been vectorized with respect to LiDAR point cloud. Distributed power lines, Secondary lines, Guy wires and edge of roads.
- We have represented the utility Pole by placing a point at bottom and top and joined these two points with line (utility pole). Guy wire has been represented with a line by joining two attachments (top and ground). Transformer has been represented by placing a point at its center of point cloud.
- Edge of the road has been represented by placing a line.
- Contours have been generated with automatic method using bare earth LiDAR point cloud.
- Finally the Corridor Power line mapping from Mobile LiDAR data has been produced.
- Classified LiDAR data in Las format and Vector map data in DXF/DGN Format.
The document describes following methodology adopted by AAM GST in processing Terrestrial LiDAR point’s data to create 3D topographic mapping and to create and update cartography data.
Scans of Terrestrial LiDAR points cloud data received from clients in LAS format processed to classify different topographic features and utilities. Surfaces and geomorphic features further extracted from stereo pairs created in Socet-Set using LidarGrammetry, utilities are represented by symbols as per the client’s requirement and specifications.
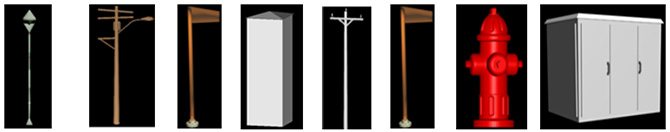
Following table shows few of the features those have been extracted from Terrestrial LiDAR point data to create 3D features and cartographic maps. Next are few of the utilities symbols those have been captured from LiDAR point’s data.
- EDGE OF ROAD
- ROAD CENTERLINE
- SIDEWALK
- CURB
- PARKING LOT
- TRAFIC STRIPE
- TRAFIC and OTHER SIGN BOARDS
- UTILITY POLE
- EDGE OF CONCRETE
- BREAK LINE
- CONTOUR
- ELECTRICAL LINE
- FIRE HYDRANT
- ELECTRICAL BOX
- LIGHT POLE
- TELEPHONE PEDESTAL
- TREE
- BENCH
- BUILDING
- MONUMENT
1. All terrestrial LiDAR scans of Riegl VZ 400 scanner merged together for area of study as shown in following picture.

Fig.1 Shows merged Raw LiDAR Point cloud
2. Automatic classification carried out to classify different features as per the specification like buildings, trees, utilities etc as shown in following picture, the automatic classified points further classified manually.
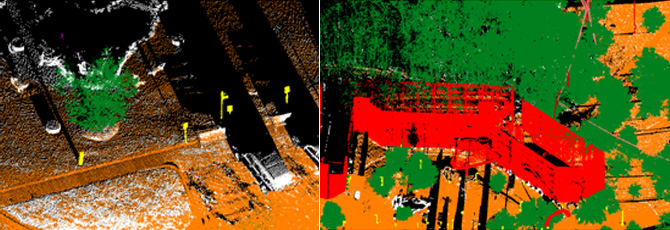
Fig.2 Classified LiDAR Point Cloud
3. Features like Building outlines, doors and windows were captured in corresponding layers from classified point cloud data as shown below.

Fig.3 Classified LiDAR Point Cloud
4. Features like Roads, Sidewalks, curbs, and contours were captured from image stereo pairs created by Lidargrammtey process from classified LiDAR point cloud data.

Fig.4 Classified LiDAR Point Cloud and extracted features
5. The trees are represented by 3D Cells from the vegetation layer at their correct location, these cells further scaled and rotated as per the actual size and shape of the trees.
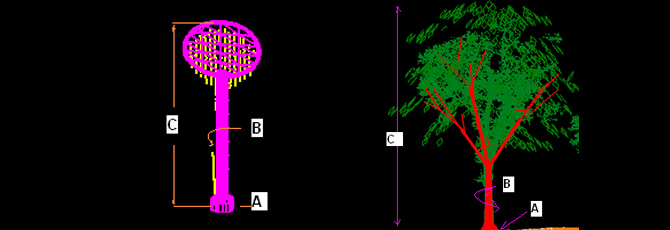
Fig.5 In the above pictures the Sign Board was scaled to the size C and rotated by an amount of B and finally these cells were exactly positioned at location A by snapping to the corresponding LiDAR point.
Final output data is 3D TOPOGRAPIC map as shown below with features those are listed earlier.

Fig.6 Final 3D MAP from Terrestrial LiDAR Scans
Project Description
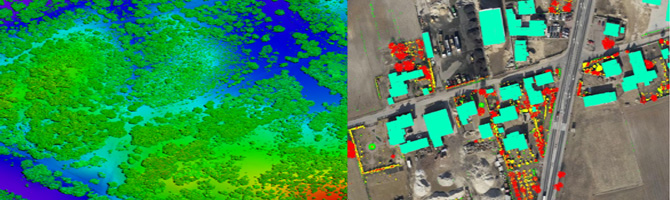
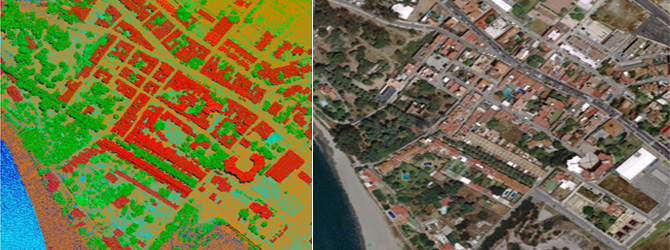
- Project consists of Airborne LiDAR data classification. It also includes the aerial triangulation of simultaneously acquired images and orthophoto generation by using LiDAR bare earth data as input DTM. It is a coastal area of 435 sq km with mountain ranges with some deeply cut drains flowing in all directions toward coast. It has cliff areas and flood plains. Rich geological formations and forest areas.
| LiDAR Project Area | : | 435 Sq Km. and Point density: 15pts/m2 |
| No of images used in aerial triangulation | : | 1959 images at 12 micron resolution. |
| GSD of orthophoto | : | 0.1m |

Product 1 : Classified LAS tiles as per Specifications.
Product 2 : Triangulation results of aerial images (PATB, ZI)
Product 3 : Orthophoto tiles as per the provided index.
LiDAR data preparation
- Project setup has been done by using clinet provided LAS tiles and boundries with their respective names.
- Flightline overlap has been removed in all the tiles in the block.
Classification of LiDAR point cloud
- Classification of LiDAR data has been done mainly in two steps.
a) Recovery of valid data from other classes.
b) Cleaning of each class by transferring the unwanted data to other classes. - Recovery of valid ground points from other classes at road edges, embankments, along the streams and below vegetation areas.
- Checking and recovery for missing vegetation points from unclassified and vegetation classes and same time transfer of unwanted points to other respective classes.
- Checking and recovery for missing vegetation points from unclassified, building and the vegetation class. Classification of unwanted points to other respective classes, thus the Vegetation class is finalized
- Classification of bridges to building classes
- Classification of water bodies (streams, rivers, coast line)
- Finally ground class has been finalized by removing artifacts in ground class.

- Quality checking has been done by panning the whole tile area and by creating editable models. wrongly classified points has been corrected.
- Ensure the Point classes as per the given List
- Refer the detailed Quality Check List
| No other class should exist except below mentioned class in final LAS tile. | |
| 1 | Default |
| 2 | Ground |
| 3 | Low vegetation |
| 4 | Medium vegetation |
| 5 | High vegetation |
| 6 | Building |
| 7 | Low point |
| 8 | Model keypoints |
| 11 | sea |
| 12 | other_water |
| 13 | bridge |
| 90 | overlap (Do not Touch this layer) |
| 91 | noise |
| 92 | out (Do not Touch this layer) |
| Make sure that data exist in proper layer and verify the LiDAR data as per checklist. | |
Classified LAS tiles, AT results and Orthophoto tiles of size 1K.
Project Flow Chart